| Week | TotalRevenue | TotalUnits | TotalDiscount |
|---|---|---|---|
| 2021-11-29 | 7302.42 | 2622 | 509.22 |
| 2021-12-06 | 7637.70 | 72 | 1781.16 |
| 2021-12-13 | 10928.76 | 372 | 2491.44 |
| 2021-12-20 | 7326.18 | -408 | 2132.88 |
| 2021-12-27 | 1763.82 | 246 | 365.28 |
The Five Ws of WSLCB’s CCRS Traceability Report
CCRS
Cannabis
Holiday
Weekly Totals
Weekly Revenue by License
# A tibble: 20 × 5
# Groups:   Week [5]
   Week       LicenseeId BusinessName                  WeeklyRevenue WeeklyUnits
   <date>     <chr>      <chr>                                 <dbl>       <dbl>
 1 2021-11-29 1031       LUCID                                 3832.        1828
 2 2021-11-29 1031       GREEN LADY LACEY                      1916.         914
 3 2021-11-29 2105       LUCID AUBURN, 21+ CANNABIS, …         1094.         -90
 4 2021-11-29 39         LUCID PUYALLUP                         461.         -30
 5 2021-12-06 2105       LUCID AUBURN, 21+ CANNABIS, …         3244.        -234
 6 2021-12-06 1031       LUCID                                 2096.         276
 7 2021-12-06 39         LUCID PUYALLUP                        1250.        -108
 8 2021-12-06 1031       GREEN LADY LACEY                      1048.         138
 9 2021-12-13 1031       LUCID                                 3953.         468
10 2021-12-13 2105       LUCID AUBURN, 21+ CANNABIS, …         3372.        -210
11 2021-12-13 1031       GREEN LADY LACEY                      1977.         234
12 2021-12-13 39         LUCID PUYALLUP                        1627.        -120
13 2021-12-20 2105       LUCID AUBURN, 21+ CANNABIS, …         2718.        -174
14 2021-12-20 39         LUCID PUYALLUP                        2288.        -138
15 2021-12-20 1031       LUCID                                 1547.         -64
16 2021-12-20 1031       GREEN LADY LACEY                       773.         -32
17 2021-12-27 2105       LUCID AUBURN, 21+ CANNABIS, …          722.         -54
18 2021-12-27 1031       LUCID                                  504          216
19 2021-12-27 39         LUCID PUYALLUP                         286.         -24
20 2021-12-27 1031       GREEN LADY LACEY                       252          108
Weekly Discounting Analysis
weekly_discounts <- sales_weekly %>%
  filter(Revenue > 0) %>%
  group_by(Week) %>%
  summarise(
    AvgDiscount = mean(Discount, na.rm = TRUE),
    TotalDiscount = sum(Discount, na.rm = TRUE),
    PercentDiscounted = mean(Discount > 0) * 100,
    .groups = "drop"
  )

# View table
#print(weekly_discounts)

# Optional: plot discount trends
ggplot(weekly_discounts, aes(x = Week)) +
  geom_line(aes(y = AvgDiscount), color = "purple", size = 1.1) +
  geom_point(aes(y = AvgDiscount), color = "purple", size = 2) +
  scale_y_continuous(name = "Average Discount ($)", labels = dollar_format()) +
  labs(
    title = "Weekly Average Discount",
    x = "Week"
  ) +
  theme_minimal()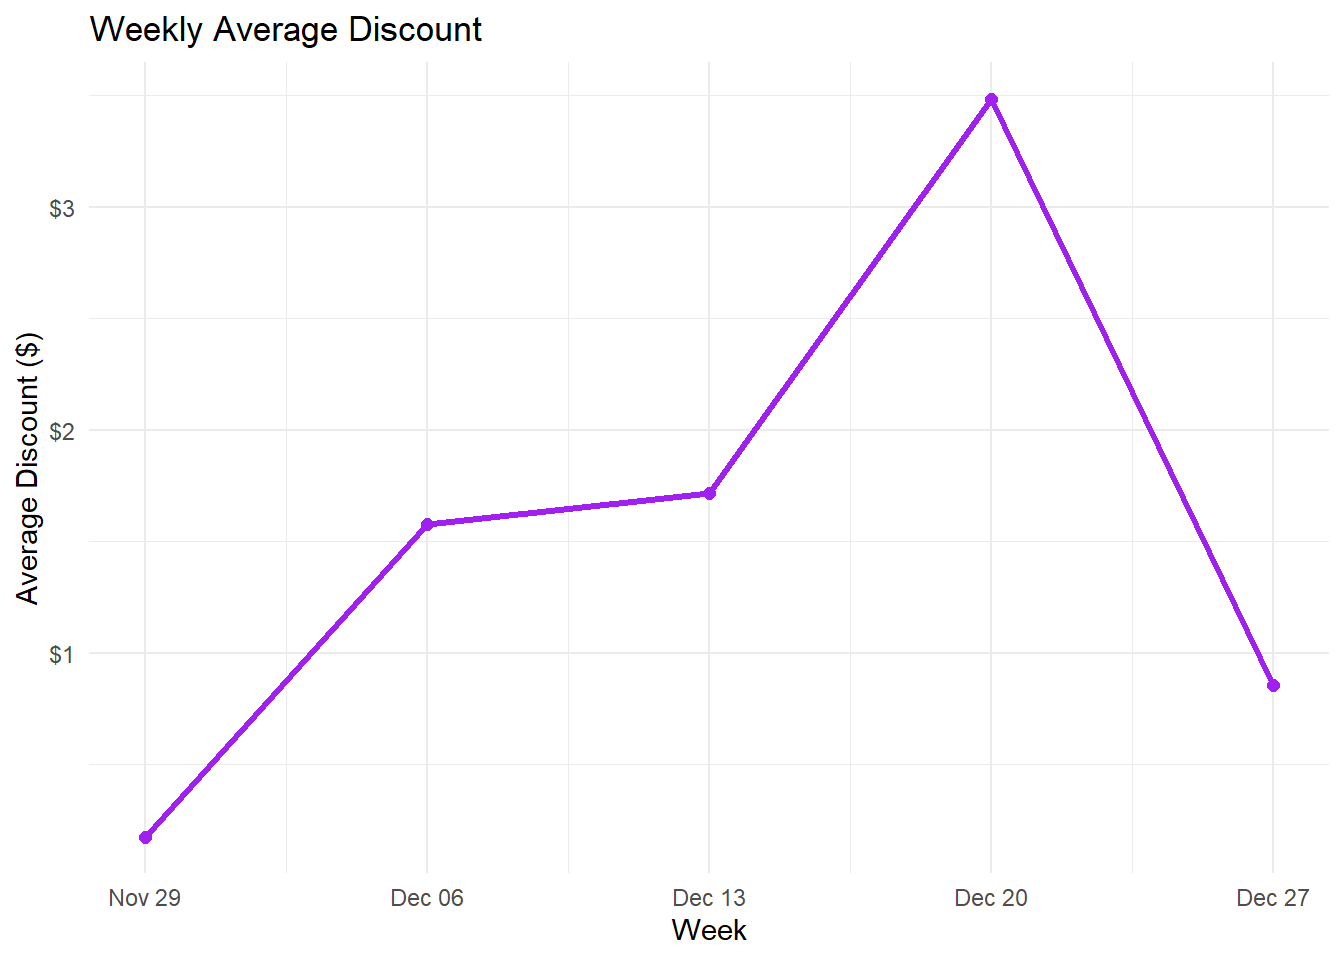
Join the Discussion
Your insights help drive better transparency and smarter policy in Washington’s cannabis industry.