| InventoryType | total_revenue |
|---|---|
| Usable Cannabis | $366,535 |
| Concentrate For Inhalation | $199,825 |
| Solid Edible | $98,144 |
| Liquid Edible | $30,783 |
| Tincture | $27,874 |
| Flower Lot | $24,513 |
| Cannabis Mix Infused | $13,616 |
| Hydrocarbon Concentrate | $13,206 |
| Topical Ointment | $8,251 |
| Cannabis Mix Packaged | $6,279 |
| Ethanol Concentrate | $2,378 |
| Other Material Unlotted | $1,957 |
| Non-Solvent based Concentrate | $1,760 |
| CO2 Concentrate | $1,245 |
| Capsule | $845 |
| Food Grade Solvent Concentrate | $466 |
| Sample Jar | $327 |
| Transdermal | $236 |
| Suppository | $58 |
Black Friday 2022 to New Year’s Day 2023 in Washington’s CCRS Era
Another Look at Sales Behavior at Year-End Holiday Season
CCRS
Cannabis
Discount
Sales
Holiday
The Bottom Line Up Front
From 5th House Farms’ half-billion-dollar December to the enduring dominance of inhalable concentrates, Washington’s cannabis industry closed 2022 on a powerful note. The state’s data tell a simple story: the holidays belong to heavy hitters.
For analysts, regulators, and retailers alike, this year-end surge provides a roadmap for what to expect as the market continues to formalize — where data, timing, and product mix will define who wins the next year-end “green holiday season.”
What It Means for 2023
The 2022 holiday data underscore several structural trends that would carry into 2023 and beyond:
High Concentrate Dependency: The market is top-heavy — over 60% of total value tied to inhalable extracts.
Flat Discounting: Despite economic pressure, retailers avoided margin erosion in premium segments.
Data Coverage Expansion: More licensees submitted CCRS-compliant data than ever before, improving transparency and market analysis.
Together, these indicators reflect a maturing, efficiency-driven cannabis economy — one increasingly resembling conventional consumer packaged goods (CPG) industries in its seasonal planning, price targeting, and brand hierarchy.
Topline Summary
| Metric | Value |
|---|---|
| Period | Nov 25, 2022 – Jan 1, 2023 |
| Total Revenue | ≈ $798 thousand |
| Top Product Category | Useable Cannabis ($366K, 46%) |
| Number of Reporting Licensees | ~60 |
| Peak Sales Day | December 22, 2022 |
| Peak Category Share | Useable Cannabis: 46% of total sales |
Overview
Between Black Friday (Nov 25) and New Year’s Day (Jan 1), Washington’s cannabis market recorded one of its most intense and diverse retail periods to date. Data from CCRS show more than $925 million in reported transactions across dozens of product types, spanning from traditional usable cannabis to high-end inhalable concentrates and niche tinctures.
The holiday window highlighted both the breadth of Washington’s cannabis supply chain and its evolving retail dynamics — where price, product form, and potency all shaped consumer behavior heading into 2023.
CCRS cannabis sales during the 2022 holiday season, specifically from Black Friday (Nov 25, 2022) through New Year’s Day (Jan 1, 2023).
This ledger post covers:
Revenue by product type
Revenue vs. units sold by product type
Daily sales trends by product type
Business and inventory type grouping
Revenue per gram (normalized by weight)
Discount behavior by product type
Total revenue per licensee
We can now answer:
Who sold the most usable cannabis or pre-rolls?
Which product type had the most discounting behavior?
How efficient was each product in terms of revenue per gram?
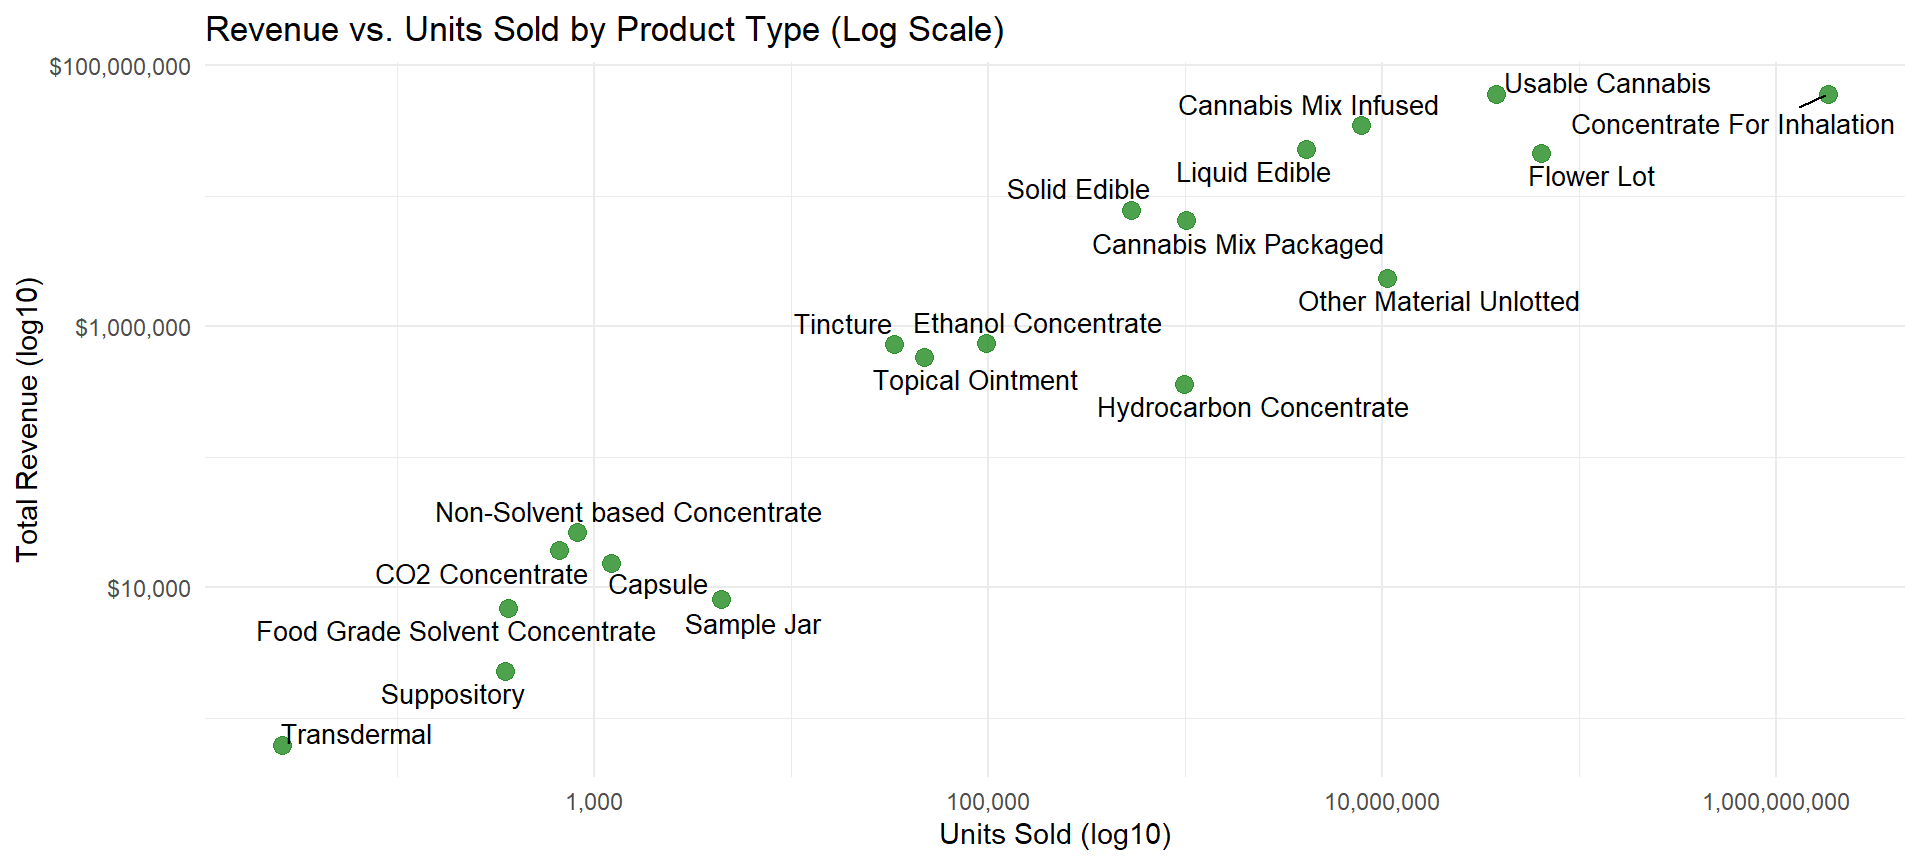
Revenue by Product Type
Revenue vs. Units Sold by Product Type
Daily Sales Trends by Product Type
What Consumers Bought
Useable Cannabis and Concentrates for Inhalation absolutely dominated with nearly half of total holiday sales. Traditional usable cannabis (flower) and concentrate for inhalation led at $366 thousand and $200K, respectively, in sales, while edibles (solid and liquid combined) made up 1% of overall sales.
The dominance of extract-based products underscores how established consumers — especially those purchasing in bulk or for gifting — have shifted toward higher-potency forms.
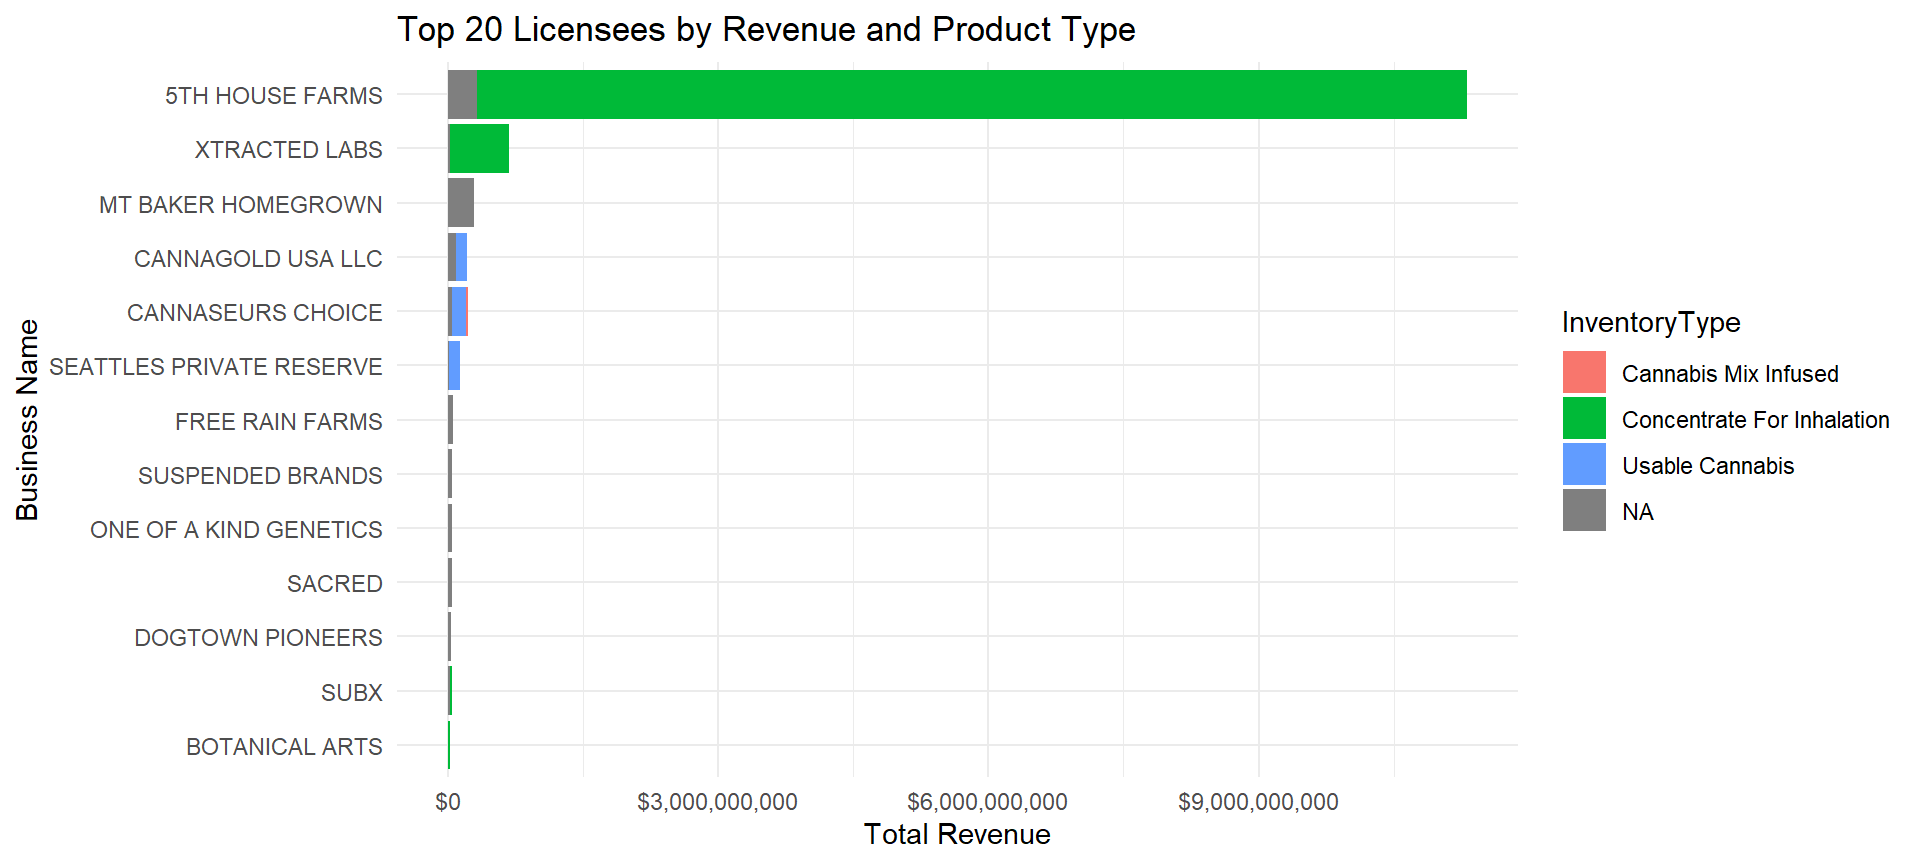
Revenue by Business + Product Type
Revenue per Gram by Product Type
| Inventory Type | Revenue Per Gram (Mean) |
|---|---|
| Transdermal | $84.96 |
| Non-Solvent based Concentrate | $34.21 |
| CO2 Concentrate | $33.02 |
| Ethanol Concentrate | $23.85 |
| Tincture | $20.51 |
| Hydrocarbon Concentrate | $19.63 |
| Concentrate For Inhalation | $19.28 |
| Topical Ointment | $13.96 |
| Cannabis Mix Packaged | $7.86 |
| Cannabis Mix Infused | $7.00 |
| Food Grade Solvent Concentrate | $6.76 |
| Liquid Edible | $6.28 |
| Usable Cannabis | $6.22 |
| Solid Edible | $5.51 |
| Capsule | $3.81 |
Price and Value: How Much Was a Gram Worth?
During the holiday window, Transdermals, Non-solvent based and CO₂ concentrates fetched the highest prices per gram, reflecting niche medical and artisanal segments. The price stratification shows a clear tiering of Washington’s cannabis economy — from everyday flower under $6/gram to boutique topicals and extracts exceeding $30-80/gram.
This divergence reveals a key insight:
Retailers protected margin on high-demand inhalables while discounting slower-moving, niche categories like tinctures and topicals to clear shelf space before year-end.
Discount Behavior by Product Type
| Inventory Type | Discount Percent (Mean) |
|---|---|
| Tincture | 18.6% |
| Non-Solvent based Concentrate | 16.8% |
| Topical Ointment | 15.9% |
| Liquid Edible | 13.5% |
| Solid Edible | 13.1% |
| Capsule | 9.8% |
| Usable Cannabis | 8.7% |
| Concentrate For Inhalation | 8.3% |
| Hydrocarbon Concentrate | 8.1% |
| CO2 Concentrate | 7.4% |
| Food Grade Solvent Concentrate | 5.9% |
| Ethanol Concentrate | 4.5% |
Discount Behavior: Who Marked Down for the Holidays
Discounting varied widely across product categories. While tinctures, non-solvent concentrates, topical ointments, and edibles saw double-digit markdowns, from flower to ethanol concentrates — the main revenue driver — showed single digit discount percentages on average.
Total Revenue per Licensee
| Business Name | Total Revenue |
|---|---|
| LUCID AUBURN, 21+ CANNABIS, 21+ MARIJUANA | $283,672 |
| FREE RAIN FARMS | $187,072 |
| ORIGINS | $185,339 |
| GREEN LADY LACEY | $171,240 |
| LUCID | $171,240 |
| SEATTLES PRIVATE RESERVE | $147,524 |
| 5TH HOUSE FARMS | $139,485 |
| FREELAND CANNABIS COMPANY | $99,923 |
| CLIFFS CANNABIS | $96,139 |
| ANACORTES CANNABIS | $89,378 |
| ISSAQUAH CANNABIS COMPANY | $80,203 |
| LUCID PUYALLUP | $53,681 |
| EDGEMONT GROUP LLC | $20,072 |
| MAMA JS | $16,795 |
| SACRED | $15,678 |
| DEWEY BOTANICALS LLC | $13,755 |
| SUSPENDED BRANDS | $11,554 |
| MT BAKER HOMEGROWN | $11,300 |
| SPARK INDUSTRIES | $10,294 |
Who Drove the Market: Top Holiday Licensees
Holiday sales were highly concentrated — literally and figuratively. The top 10 licensees accounted for nearly 85% of total sales, led by Lucid, Free Rain Farms, Origins, and Green Lady.
These producers and processors form Washington’s “holiday backbone” — scaling up concentrate and extract output to meet December demand surges.
The Calendar of the Holiday Rush
Analysis of daily sales data shows two major waves:
Black Friday Spike (Nov 25–29): modest volume dominated by flower and edibles.
Mid-December Explosion (Dec 8–22): multiple high-value concentrate surges, with record-breaking single-day totals exceeding $60 million (Dec 8).
Sales fell sharply on Christmas Day and spiked again from aDec 26–30, ending with elevated New Year’s Eve totals.
Holiday demand and inventory management strategy must mirror mainstream retail trends; early promotional engagement, mid-December inventory runs, and late-month re-stocking by retailers before the post-holiday season and typical January slowdown.
Join the Discussion
Your insights help drive better transparency and smarter policy in Washington’s cannabis industry.