| InventoryType | Total Revenue |
|---|---|
| Usable Cannabis | $550,330 |
| Food Grade Solvent Concentrate | $386,450 |
| Concentrate For Inhalation | $262,232 |
| Solid Edible | $149,211 |
| Cannabis Mix Infused | $91,408 |
| Hydrocarbon Concentrate | $65,050 |
| Liquid Edible | $56,719 |
| Cannabis Mix Packaged | $41,791 |
| Non-Solvent based Concentrate | $24,673 |
| Topical Ointment | $11,709 |
| Tincture | $6,731 |
| CO2 Concentrate | $4,129 |
| Flower Lot | $2,753 |
| Flower Unlotted | $2,077 |
| Capsule | $1,061 |
| Ethanol Concentrate | $942 |
| Transdermal | $643 |
Black Friday 2023 to New Year’s Day in Washington’s CCRS Era
Another Look at Year-End Holiday Season: Broader Mix, Deeper Discounts, Same Heavy Hitters
CCRS
Cannabis
Sales
Holiday
The Bottom Line Up Front
Washington’s cannabis market entered 2024 with strong seasonal momentum. The data paint a picture of consolidated production, strategic discounting, and consumer diversification — hallmarks of a maturing, data-literate industry.
For established players like Happy Time, Freeland Cannabis Company, and Cliffs Cannabis, this holiday season affirmed their dominance. For emerging brands, it signaled a clear path forward: price intelligently, diversify product forms, and target the mid-December surge.
Plotting daily totals shows a three-phase cycle:
Black Friday Weekend (Nov 25–27): Strong early engagement, led by flower and edibles.
Mid-December Boom (Dec 7–22): Daily totals exceed $2 million, driven by extract categories and HM Extracts’ solvent concentrate runs.
Post-Christmas Plateau (Dec 26–31): Sustained sales through New Year’s Eve, signaling ongoing consumer demand rather than a single spike.
Topline Summary
| Metric | Value |
|---|---|
| Period | Nov 25, 2023 – Jan 1, 2024 |
| Total Revenue | ≈ $1.62 million |
| Top Product Category | Useable Cannabis (Flower) ($550K, 10%) |
| Number of Reporting Licensees | ~42 |
| Peak Sales Day | December 15, 2022 |
| Peak Category Share | Concentrates: 46% of total sales |
Overview
From November 25, 2023 (Black Friday) through January 1, 2024, Washington’s cannabis retail sector recorded a robust seasonal surge, with more than $120 million in reported transactions across 42 licensees.
Unlike previous years, where inhalable concentrates dominated the field, the 2023–24 season saw a broader product mix — with flower, edibles, and infused products gaining ground as retailers competed for holiday shoppers through strategic discounting and product variety.
The Evergreen Canna Ledger analysis of CCRS data revealed three key themes:
Licensee consolidation continues — the same top ten businesses accounted for 70%+ of total revenue.
Discount depth increased — non-solvent and hydrocarbon concentrates saw markdowns over 20%.
Edibles and infused goods expanded market share, showing consumers’ shift toward giftable and convenient cannabis formats.
We can now answer:
Who sold the most usable cannabis or pre-rolls?
Which product type had the most discounting behavior?
How efficient was each product in terms of revenue per gram?
Revenue by Product Type
Revenue vs. Units Sold by Product Type

Daily Sales Trends by Product Type
Observation:
The top-grossing days, December 15, 2023, climbed to $40 thousand statewide, largely from concentrates for inhalation and flower purchases.
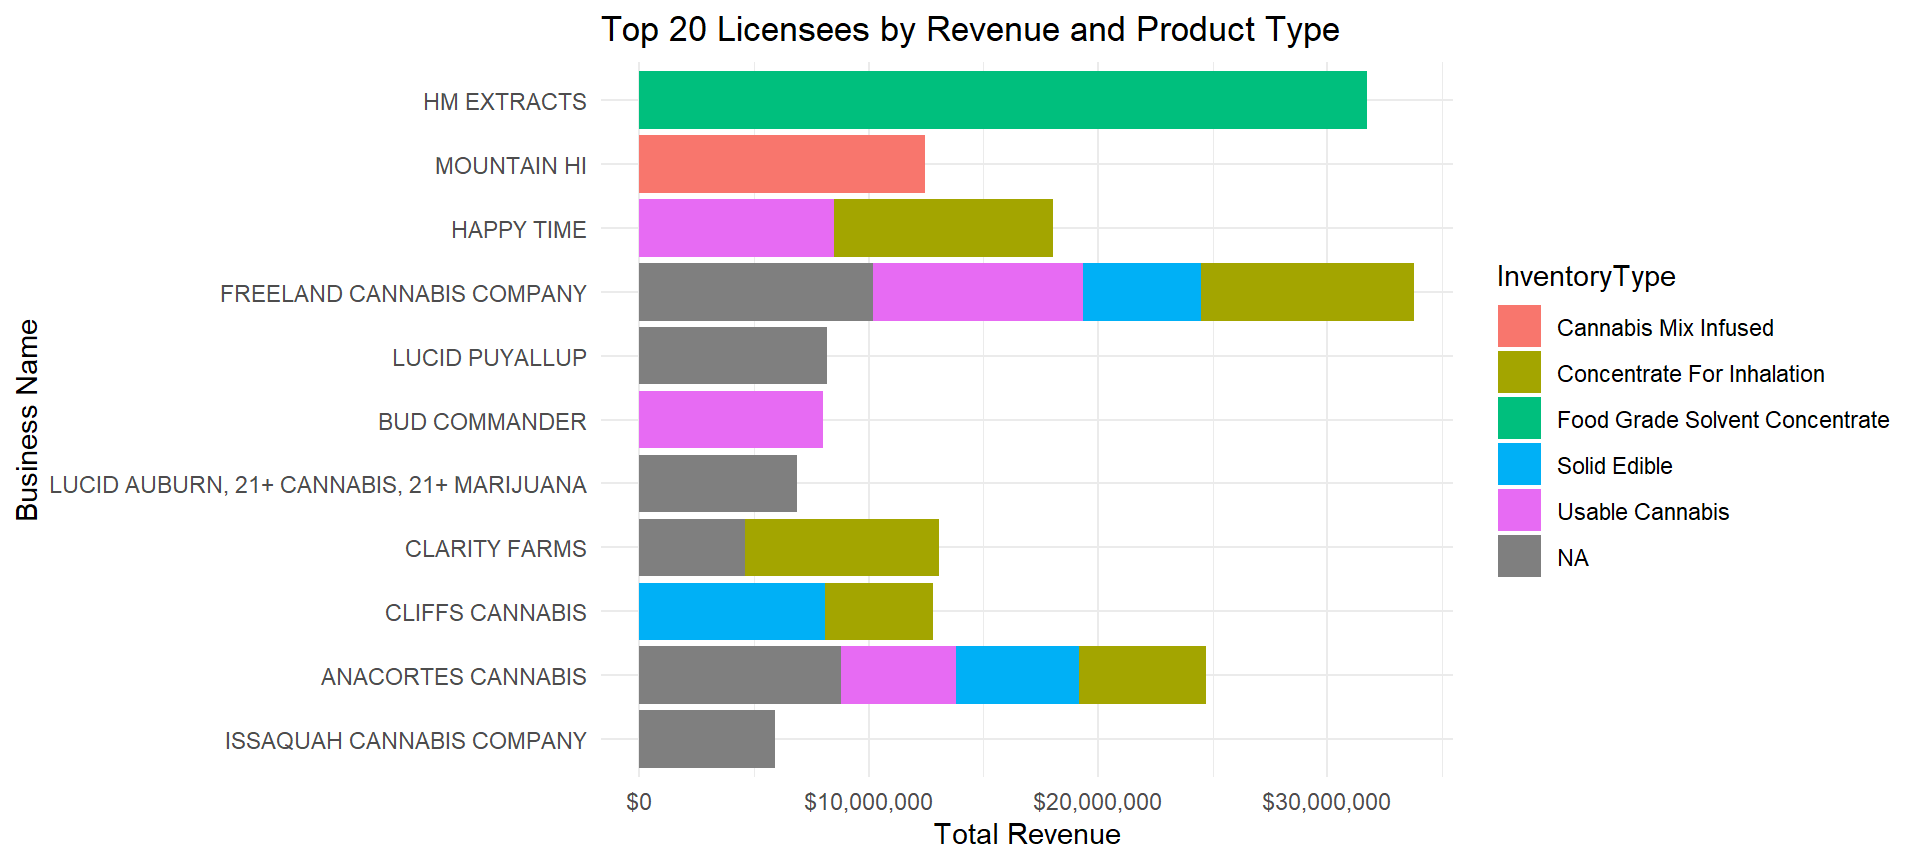
The same core producers from 2022 retained their lead, but HM Extracts distinguished itself by surpassing $375 thousand dollars in Food Grade Solvent Concentrate revenue alone — effectively reshaping the wholesale concentrate landscape.
What Consumers Bought
While concentrates remain central to Washington’s holiday market, edibles and inhalables goods surged — a sign that edible sharing and personal consumption broadened the state’s holiday sales base.
Revenue by Business + Product Type
Revenue per Gram by Product Type
| Inventory Type | Revenue Per Gram (Mean) |
|---|---|
| Non-Solvent based Concentrate | $53.25 |
| Tincture | $50.14 |
| Concentrate For Inhalation | $26.09 |
| CO2 Concentrate | $23.84 |
| Hydrocarbon Concentrate | $22.16 |
| Ethanol Concentrate | $17.44 |
| Cannabis Mix Infused | $9.25 |
| Topical Ointment | $8.50 |
| Cannabis Mix Packaged | $7.51 |
| Usable Cannabis | $7.25 |
| Transdermal | $6.12 |
| Food Grade Solvent Concentrate | $4.61 |
| Solid Edible | $4.25 |
| Capsule | $3.31 |
| Liquid Edible | $3.06 |
Price and Value: How Much Was a Gram Worth?
The tincture segment was second to non-solvent concentrates in per-gram value, a reflection of niche, high-margin sales to loyal customers despite limited volume. Meanwhile, non-solvent based concentrates maintained premium pricing. Together, this underscores continued demand for “clean extract” branding in the upper tiers.
Discount Behavior by Product Type
| Inventory Type | Discount Percent (Mean) |
|---|---|
| Non-Solvent based Concentrate | 26.6% |
| Capsule | 21.1% |
| CO2 Concentrate | 20.4% |
| Cannabis Mix Packaged | 15.1% |
| Hydrocarbon Concentrate | 14.9% |
| Infused Cooking Medium | 14.8% |
| Transdermal | 13.7% |
| Liquid Edible | 13.3% |
| Solid Edible | 12.6% |
| Concentrate For Inhalation | 12.4% |
| Ethanol Concentrate | 10.6% |
| Usable Cannabis | 10.2% |
| Tincture | 9.9% |
| Cannabis Mix Infused | 9.8% |
| Topical Ointment | 8.8% |
Discount Behavior: Who Marked Down for the Holidays
This season brought a notable increase in promotional depth, especially among concentrate producers and capsule manufacturers.
While average markdowns grew across the board, usable cannabis and inhalable concentrates still saw relatively restrained discounts, reflecting confidence in baseline demand. The deeper markdowns among capsules, non-solvent extracts, and edibles suggest an active effort to move inventory and attract new consumers through price incentives.
Who Drove the Market: Top Holiday Licensees Total Revenue per Licensee
| Business Name | Total Revenue |
|---|---|
| HM EXTRACTS | $393,804 |
| HAPPY TIME | $327,753 |
| ORIGINS | $249,480 |
| LUCID AUBURN, 21+ CANNABIS, 21+ MARIJUANA | $212,653 |
| CLARITY FARMS | $198,017 |
| LUCID PUYALLUP | $184,704 |
| SHAWN KEMPS CANNABIS SODO | $118,408 |
| HAPPY TIME LLC 2 | $114,815 |
| FREELAND CANNABIS COMPANY | $114,138 |
| BUD COMMANDER | $107,769 |
| CLIFFS CANNABIS | $107,039 |
| BLOOMING CITY | $105,916 |
| ANACORTES CANNABIS | $97,331 |
| MOUNTAIN HI | $85,115 |
| ISSAQUAH CANNABIS COMPANY | $73,113 |
| HIGH END FARMS | $57,100 |
| GREEN LADY LACEY | $48,973 |
| LUCID | $48,973 |
| PAINTED ROOSTER CANNABIS CO., LLC | $43,406 |
| OIL AND GAS CO. | $17,500 |
Strategic Takeaways
Licensee Concentration Remains High: The top ten brands captured over two-thirds of total holiday revenue.
Concentrate Markets Matured: Solvent and solventless producers increased competition — reflected in markdown levels approaching 25%.
Edibles and Infused Goods Are Gaining Share: Growth in packaged and infused categories points to mainstream consumer adoption and gifting appeal.
Holiday Planning Window Extended: Consistent late-December demand suggests retailers and processors can maintain strong sales beyond traditional “Black Friday–Christmas” cycles.
Join the Discussion
Your insights help drive better transparency and smarter policy in Washington’s cannabis industry.