Deleted vs. Active SKUs Among Licensees For Use in Branding and Product Lifecycle Analyses (2021–2025)
How SKU Lifecycles Reveal Brand Discipline in Washington’s Cannabis Market
CCRS
Cannabis
Product
Lifecycle
The Bottom Line Up Front
The Washington cannabis marketplace is evolving from growth through addition to refinement through deletion. Where once success meant more SKUs, now it’s about fewer, better, longer-lived products.
In that sense, SKU churn is not failure — it’s constructive feedback. It reflects a maturing ecosystem learning to balance innovation with brand identity.
For Branding
Do brands with high SKU churn have stronger or weaker naming consistency?
Are some licensees experimenting more (lots of deleted SKUs)?
For Lifecycle
Track SKU survivorship: what % of SKUs survive X months?
Flag licensees with unusually high SKU mortality rates.
Business Acumen Challenge
Q1: Do brands with high SKU churn have weaker naming consistency?
Q2: Are some licensees experimenting more (lots of deleted SKUs)?
Q3: Track SKU survivorship — % of SKUs surviving X months.
Q4: Flag licensees with high SKU mortality (high deletion %).
Building the Lifecycle Dataset
To understand SKU health, three key tables were joined and aggregated:
| Dataset | Purpose | Rows |
|---|---|---|
product_info |
Product-level inventory, name, and type | 16,460,559 |
product_lifecycle |
Product creation and deletion events | 7,450,688 |
licensee_metadata |
Business and location attributes | 1,884 |
These were used to create the Licensee Lifecycle_Stats Table — summarizing active and deleted SKUs per licensee — and the SKU Survivorship Table, which calculated the percentage of SKUs surviving six months.
Defining Active vs. Deleted SKUs
Each product in CCRS is tracked from creation through possible deletion. We defined:
Active: Products currently listed and not marked as deleted.
Deleted: Products removed from the active system (either reformulated, renamed, or discontinued).
Across 1,324 licensees, the median operator maintained between 9,000 and 12,000 active SKUs — with a small share showing measurable deletion activity.
Patterns in SKU Churn
Key Findings
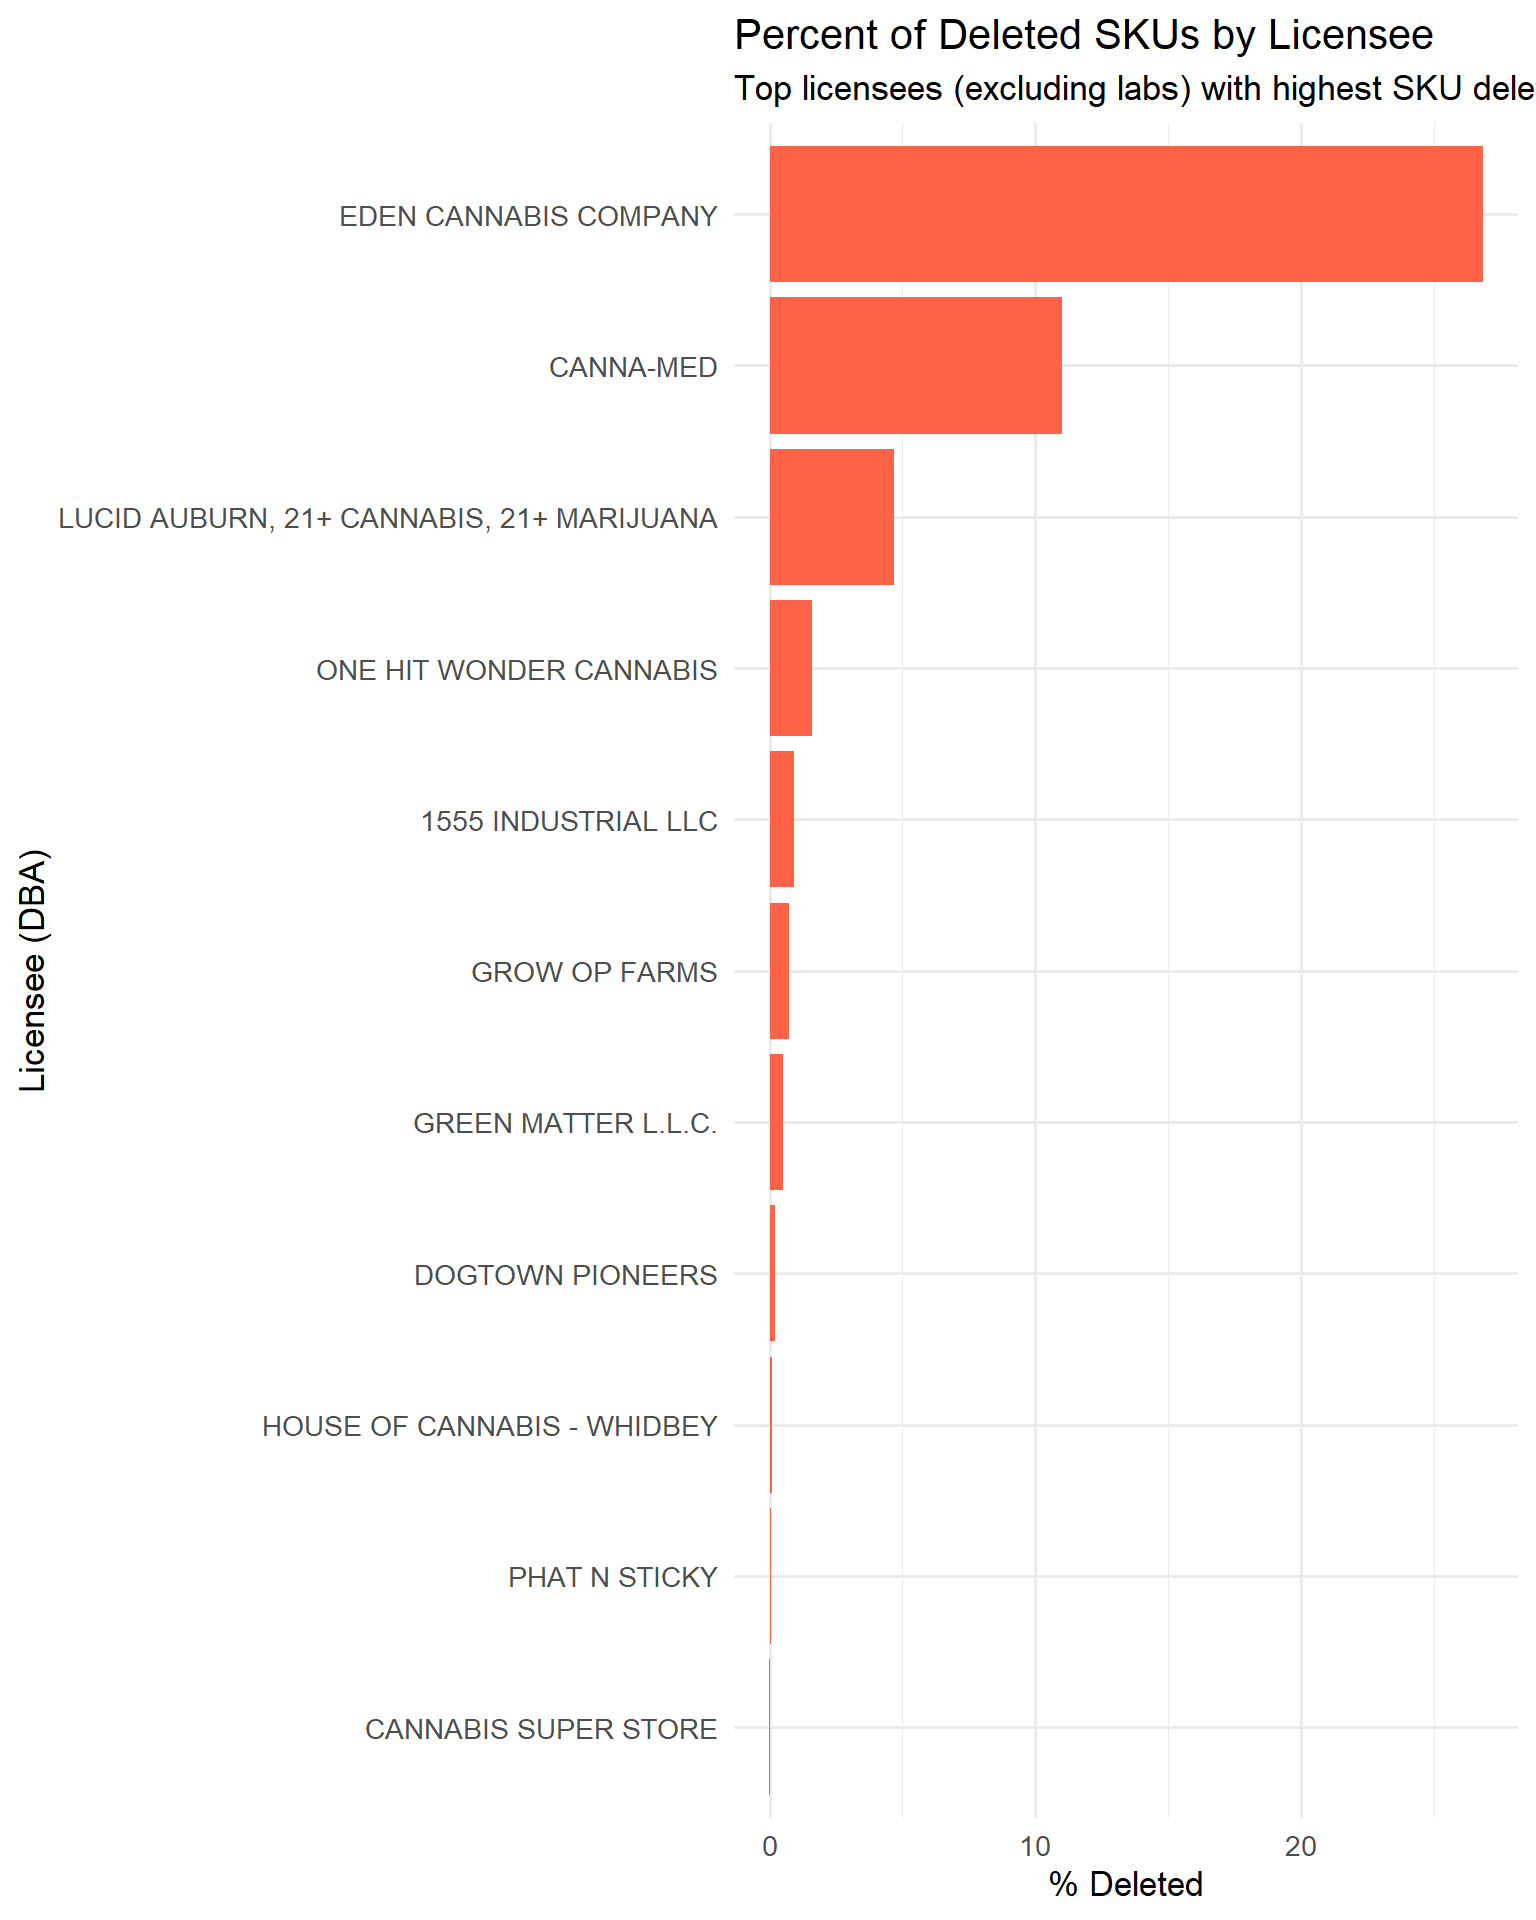
The majority of licensees (≈95%) reported no deleted SKUs — a sign of product stability or static reporting.
A small but meaningful minority (<5%) showed churn rates exceeding 10–25%, suggesting active experimentation or seasonal turnover.
Deletion peaks often correspond with brand reformulations, packaging changes, or strain reclassification events following state compliance updates.
Top Churn Drivers
Rebranding: New product names under the same formulation (e.g., “Cured Resin” → “Live Cured Resin”).
SKU Consolidation: Streamlining duplicate UPCs or package sizes.
Seasonal SKUs: Holiday drops, limited runs, and cross-licensee collaborations.
Survivorship and Market Maturity
| Metric | Median | High Performer | Low Performer |
|---|---|---|---|
| Total SKUs | 10,851 | 70,838 | <100 |
| % Survived ≥6 months | 97.5% | 100% (Evergreen Market – Renton Highlands) | 91% (Small farm licensees) |
On average, 97% of SKUs survived six months, indicating that most active products remain stable once introduced. However, a few licensees — often multi-store operators — maintain rapid turnover, balancing large active portfolios with aggressive SKU pruning.
To complement churn, we calculated SKU survivorship — the percentage of SKUs still active ≥6 months post-creation:
Interpreting Brand Behavior
The blend of Active, Deleted, and Survived SKUs offers a behavioral window into brand strategy: Every product tells a story — from creation to deletion.
As Washington’s cannabis market enters its second decade, product turnover has become one of the clearest indicators of brand maturity and market experimentation.
| Brand Behavior | SKU Signature | Strategic Implication |
|---|---|---|
| Stable Core Brands | High Active, Low Deleted | Mature portfolio with consistent labeling and compliance control |
| Experimenters | Moderate Active, High Deleted | Testing formulations or packaging (common in mid-sized processors) |
| Dormant Licensees | Low Active, Few or No Deleted | Limited sales or inactive reporting |
| High Survivors | 100% 6-month retention | Strong product-market fit, reliable sell-through |
Branding Consistency and Churn
By comparing branding detection (via product name/description matching against licensee DBA) with lifecycle data:
Self-branded products remain a small fraction of total SKUs (<5%), echoing prior ECL findings.
Brands with the highest deletion rates tend to show lower naming consistency — hinting at experimental portfolios or co-packing arrangements.
Conversely, high-survivorship brands display strong lexical uniformity (stable naming conventions, SKU prefixes, and descriptors).
The conclusion is churned SKUs reveal experimentation and surviving SKUs reflect name identity.
County-Level Observations
Mapping deleted vs. active SKUs by licensee county showed geographic nuances:
King and Spokane counties dominate total SKU creation, but deletion rates remain low — emphasizing market stability.
Smaller counties (e.g., Skagit, Okanogan) exhibit higher proportional churn, driven by boutique processors testing niche products.
This aligns with broader trends: urban stability, rural experimentation.
Why SKU Lifecycle Matters
SKU churn isn’t just noise — it’s a signal.
Tracking deletion and survivorship helps identify:
Emerging innovators (high churn, frequent product refreshes)
Operationally consistent brands (stable SKUs, long retention)
Compliance bottlenecks (spikes in deletions following CCRS schema changes)
For regulators and analysts alike, SKU lifecycle metrics offer a leading indicator of product-market fitness and business discipline.
Join the Discussion
Your insights help drive better transparency and smarter policy in Washington’s cannabis industry.