| InventoryType | TotalRevenue |
|---|---|
| Usable Cannabis | $17,456,296 |
| Concentrate For Inhalation | $10,995,856 |
| Solid Edible | $6,396,985 |
| Flower Unlotted | $3,818,380 |
| Liquid Edible | $2,396,099 |
| Cannabis Mix Infused | $2,306,045 |
| Flower Lot | $2,015,963 |
| Hydrocarbon Concentrate | $1,848,874 |
| Ethanol Concentrate | $1,675,539 |
| Topical Ointment | $1,005,719 |
| Cannabis Mix Packaged | $760,503 |
| Food Grade Solvent Concentrate | $718,305 |
Black Friday to New Year’s Day 2026 in Washington’s Mature Cannabis Market
Another Look at Year-End Holiday Season: Discounting, Demand, and Market Control
Sales
Discount
Holiday
This analysis covers 2.412 million cannabis sales transactions recorded in CCRS from Black Friday 2025 through New Year’s Day 2026. Using daily transaction aggregates, product-level revenue, unit volumes, discount percentages, and licensee totals, The Evergreen Canna Ledger examined how price, volume, and market power interacted during the holiday period.
The Bottom Line Up Front
The 2025 year-end holiday season confirms what CCRS data has been signaling all year: Washington’s cannabis market is no longer adjusting — it has settled into a high-competition, low-margin equilibrium followed a familiar pattern — but with sharper edges as sales fall after major holidays. From Black Friday 2025 through New Year’s Day 2026, CCRS transaction data shows a three-phase cycle of demand concentration, discount escalation, and post-holiday retrenchment. Revenue was heavily concentrated in inhalable products, discounts were unevenly distributed across product types, and a small group of licensees captured an outsized share of total sales.
Overview
The goal is not to evaluate promotional success at the SKU level, but to understand market behavior under stress and how operators responded to seasonal demand, inventory pressure, and competitive pricing signals.
The CCRS data has revealed three key themes or market behaviors from Black Friday to New Year’s Day:
Daily revenue patterns reveal a consistent three-phase holiday structure:
1. Pre-Holiday Ramp (late November):
Revenue spikes driven by advance purchasing and early promotions.
2. Holiday Compression (mid-December):
High volatility across product types, with pronounced discounting in specific categories.
3. Post-Holiday Drop-Off (late December into New Year’s):
Sharp declines in both revenue and units sold, indicating demand pull-forward rather than sustained growth.
This cycle mirrors prior years, but with greater amplitude in discount-sensitive categories in 2025.
Plotting daily totals shows a three-phase cycle:
Revenue by Product Type
Holiday revenue remained concentrated in a narrow set of inventory types:
Usable Cannabis (flower): ~$17.5M
Concentrate for Inhalation: ~$11M
Solid Edibles: ~$6.4M
Liquid Edibles: ~$2.4M
Together, inhalable and edible products dominated holiday sales on average at a total of $19.8 million versus flower at $17.4 million USD. Lower-revenue categories — capsules, tinctures, topicals, CO2 concentrate — remained marginal despite aggressive markdowns.
The holiday market did not meaningfully expand demand into peripheral product categories. Instead, it intensified competition within already saturated segments.
Top Inventory Types (Revenue > $500K)
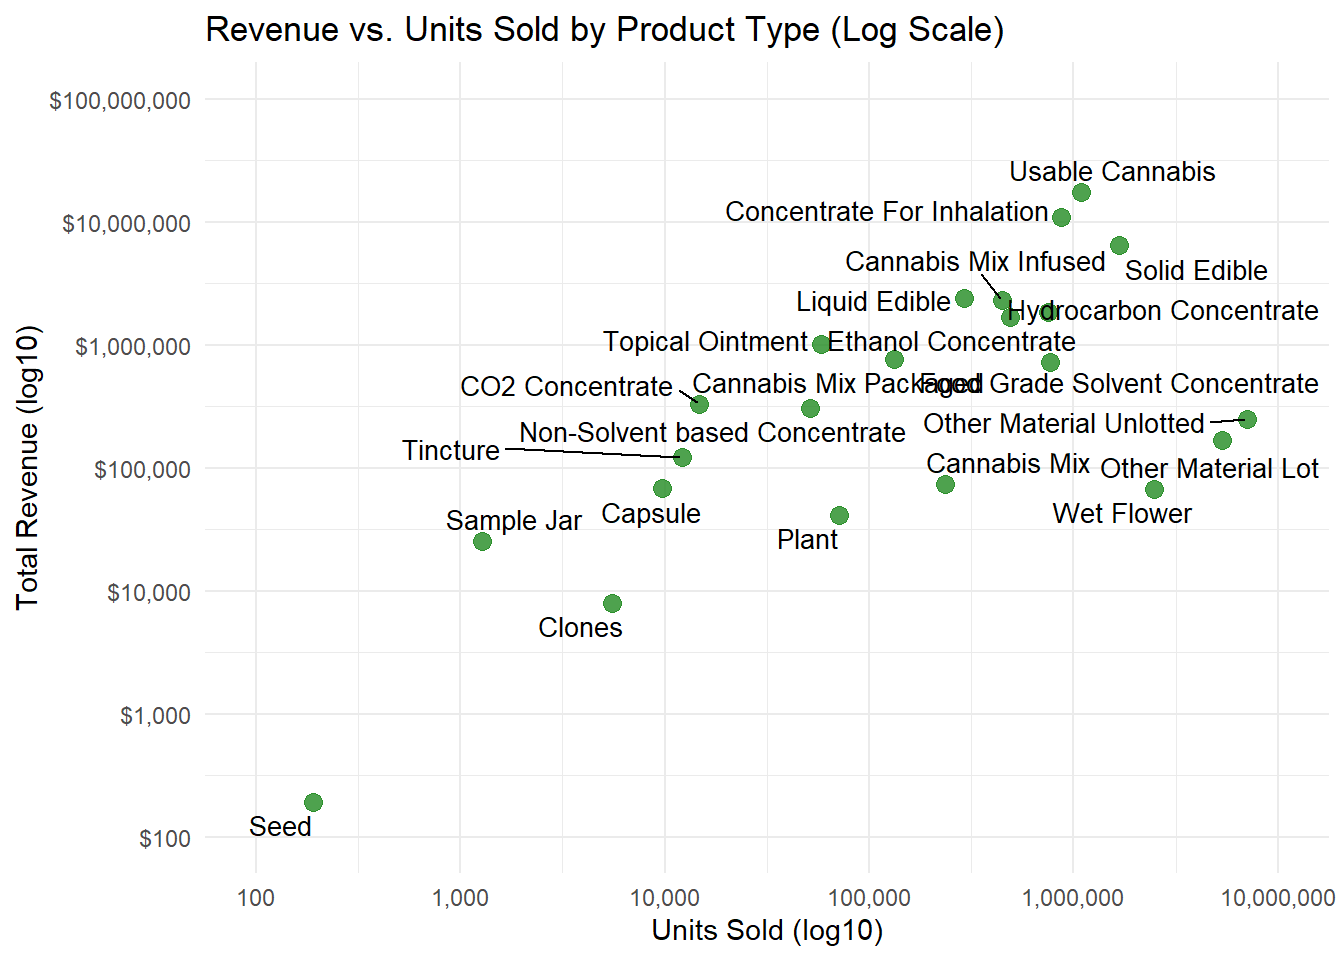
Revenue vs. Units Sold by Product Type
Plotting total revenue against units sold (log-scale) highlights a critical distinction:
High-volume, Low-value products (cannabis mix, wet flower) drive throughput but dilute per-unit value.
Lower-volume, higher-value products (capsules, tinctures, topical, and few concentrate types) generate outsized revenue per gram despite smaller unit counts and discount percentages.
This divergence explains why discounting pressure was not evenly applied across the market.
Daily Sales Trends by Product Type
Daily revenue lines show:
Concentrates and inhalables maintaining relatively stable daily revenue until late December.
Edibles exhibiting sharper peaks and steeper post-holiday declines.
Marginal categories collapsing almost immediately after peak promotional windows.
Holiday promotions largely reallocated timing, not total demand. Once promotional windows closed, demand reverted quickly.
Click/double click on a product type in the legend to remove/isolate the trend.
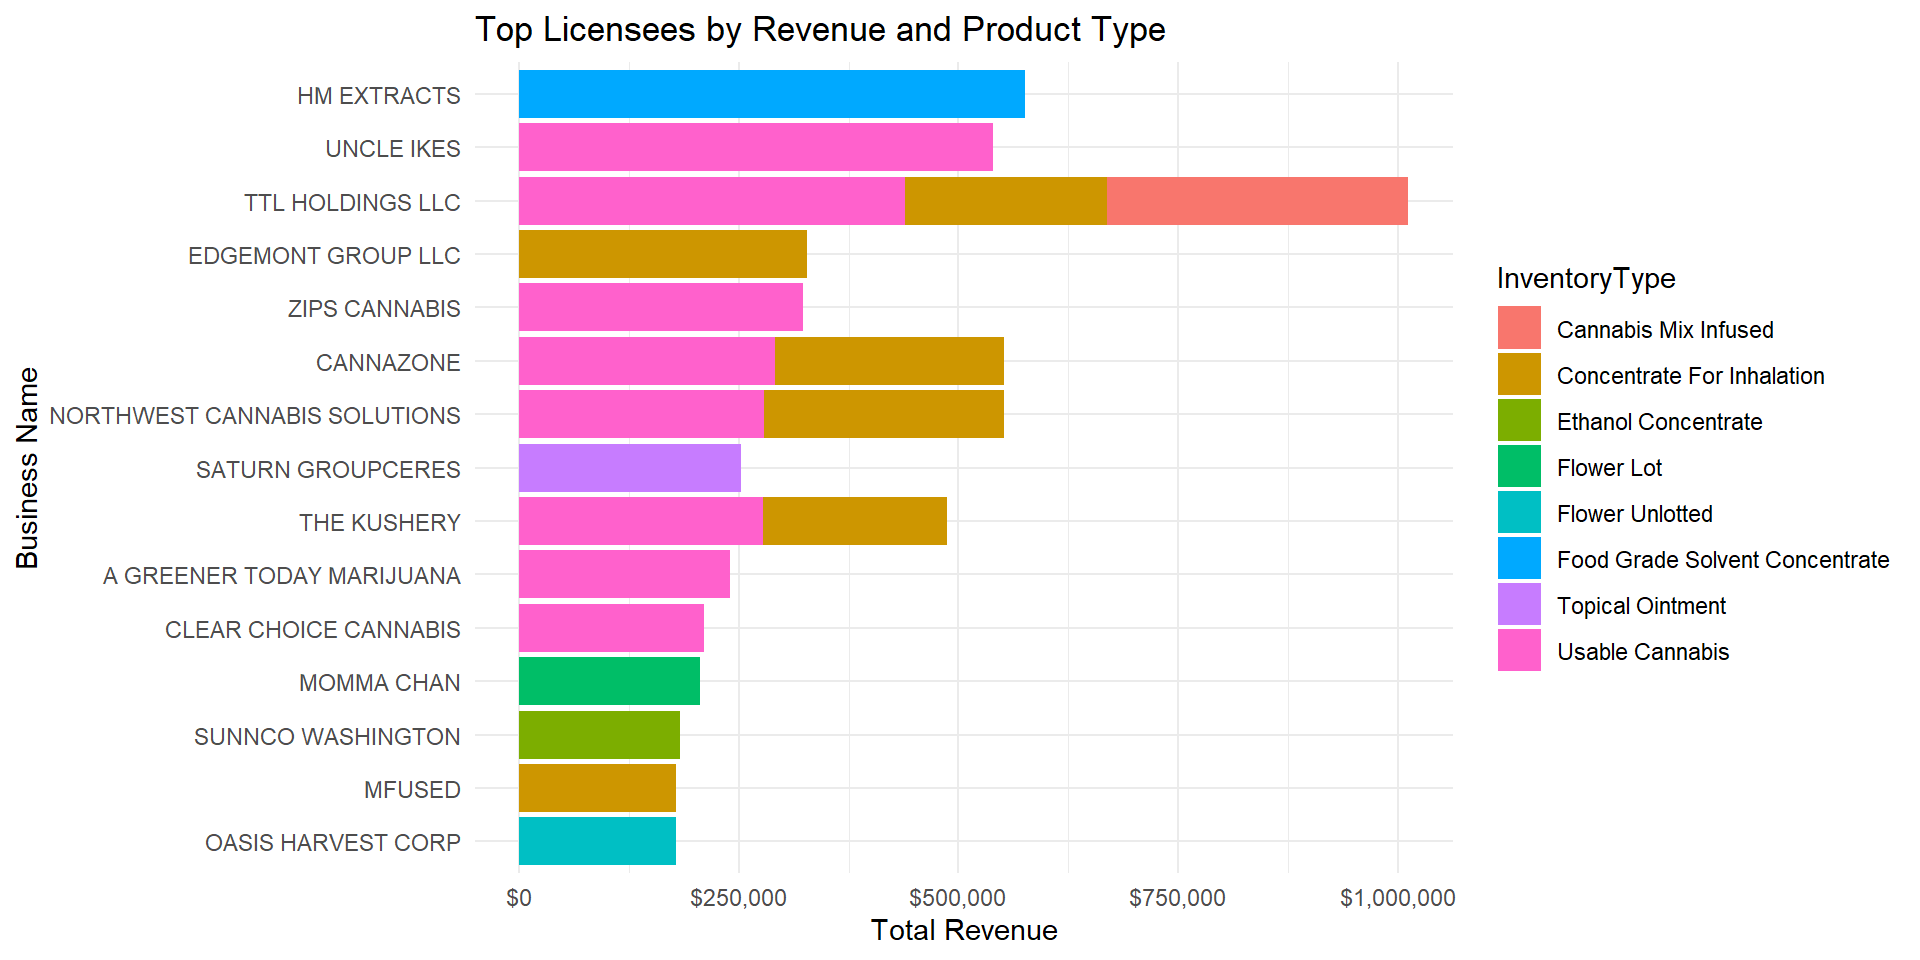
Revenue by Business + Product Type
Stacked revenue by licensee shows that large operators dominated in useable cannabis, while smaller firms were confined to concentrates with limited pricing flexibility.
This reinforces a broader structural pattern: product diversity and vertical integration provide resilience during promotional cycles.
Price and Value: How Much Was a Gram Worth?
Average revenue per gram varied dramatically by product type:
Non-solvent concentrates: $35.89/gram
Ethanol concentrates: $26.90/gram
CO₂ concentrates: $21.73/gram
Concentrate for Inhalation: $19.94/gram
Hydrocarbon Concentrate: $16.28/gram
Usable cannabis: $5.94/gram
Wet flower: ~$0.07/gram
This dispersion underscores a central reality: price competition is fiercest where differentiation is weakest. High-value concentrates maintained pricing power; bulk flower did not.
| Inventory Type | Revenue Per Gram (Mean) |
|---|---|
| Non-Solvent based Concentrate | $35.89 |
| Ethanol Concentrate | $26.90 |
| Sample Jar | $23.23 |
| CO2 Concentrate | $21.73 |
| Concentrate For Inhalation | $19.94 |
| Hydrocarbon Concentrate | $16.28 |
| Tincture | $9.90 |
| Capsule | $7.99 |
| Cannabis Mix Infused | $7.93 |
| Topical Ointment | $7.82 |
| Cannabis Mix | $6.79 |
| Usable Cannabis | $5.94 |
| Cannabis Mix Packaged | $5.60 |
| Transdermal | $5.29 |
| Plant | $5.00 |
| Solid Edible | $3.00 |
| Liquid Edible | $2.51 |
| Food Grade Solvent Concentrate | $2.45 |
| Clones | $2.44 |
| Suppository | $2.05 |
| Flower Lot | $1.26 |
| Flower Unlotted | $0.34 |
| Wet Flower | $0.07 |
| Other Material Lot | $0.03 |
| Other Material Unlotted | $0.02 |
Discount Behavior by Product Type
Discounting was not uniform:
Transdermals: 36.5% average discount
Tincture: 26.4%
Useable Cannabis: 24.3%
Hydrocarbon, non-solvent and ethanol concentrates, and liquid edible: ~23%
In contrast, topicals, cannabis mix infused, and concentrate for inhalation showed discounting below 20 percent.
Discounts were deployed strategically, not universally. Operators discounted where they could still clear volume without destroying brand positioning.
| Inventory Type | Discount Percent (Mean) |
|---|---|
| Transdermal | 36.5% |
| Sample Jar | 31.4% |
| Tincture | 26.4% |
| Usable Cannabis | 24.3% |
| Hydrocarbon Concentrate | 23.3% |
| Non-Solvent based Concentrate | 23.1% |
| Liquid Edible | 22.9% |
| Ethanol Concentrate | 22.6% |
| Solid Edible | 21.6% |
| CO2 Concentrate | 21.5% |
| Capsule | 20.1% |
| NA | 20.0% |
| Concentrate For Inhalation | 19.7% |
| Cannabis Mix Packaged | 18.0% |
| Topical Ointment | 17.9% |
| Cannabis Mix Infused | 12.9% |
| Suppository | 10.8% |
Discount Behavior: Who Marked Down for the Holidays
Licensees with the highest total holiday revenue were also among the most active discounters—but selectively. Rather than across-the-board markdowns, discounts were concentrated in specific product lines designed to protect core margins.
Smaller operators, by contrast, showed either minimal discounting or unsustainably deep cuts.
Who Drove the Market: Top Holiday Licensees
Total holiday revenue was highly concentrated:
UNCLE IKES: $1.65M
TTL HOLDINGS LLC: $1.38M
CANNAZONE: $1.15M
The top tier of licensees accounted for a disproportionate share of holiday sales, reinforcing consolidation dynamics already visible throughout 2025.
Total Revenue per Licensee
| Business Name | Total Revenue |
|---|---|
| UNCLE IKES | $1,653,512 |
| TTL HOLDINGS LLC | $1,389,905 |
| CANNAZONE | $1,159,267 |
| NORTHWEST CANNABIS SOLUTIONS | $1,098,410 |
| ZIPS CANNABIS | $901,634 |
| THE KUSHERY | $886,888 |
| A GREENER TODAY MARIJUANA | $864,992 |
| CLEAR CHOICE CANNABIS | $777,941 |
| DOCKSIDE CANNABIS | $670,874 |
| CRAFT TACOMA | $632,025 |
| THE HERBERY | $601,593 |
| WESTERN BUD | $583,830 |
| PRC | $579,359 |
| HM EXTRACTS | $575,783 |
| LUCKY LEAF | $559,581 |
| FLOYDS | $535,640 |
| EDGEMONT GROUP LLC | $523,831 |
| CRAFT CANNABIS | $515,215 |
| EUPHORIUM 420 | $512,904 |
| BUDHUT | $508,005 |
| CINDER | $500,622 |
| PHAT N STICKY | $491,680 |
| FORBIDDEN CANNABIS CLUB OLYMPIA | $475,678 |
| SHAWN KEMPS CANNABIS | $467,987 |
| HAVE A HEART | $464,067 |
| FREE RAIN FARMS | $439,563 |
| LIFTED CANNABIS | $438,725 |
| CANNABIS 21 | $433,305 |
| SATURN GROUPCERES | $421,765 |
| THE LUCKY LEAF | $408,742 |
| MARLEY 420 | $403,366 |
| BLOOM | $397,856 |
| THE HAPPY CROP SHOPPE | $388,712 |
| THE GREEN NUGGET | $383,057 |
| DANKS WONDER EMPORIUM | $381,977 |
| HASHTAG CANNABIS | $374,949 |
| ALPHA CRUX, LLC | $367,435 |
| GREENSIDE | $366,869 |
| AGRO COUTURE | $366,657 |
| SATIVA SISTERS | $366,267 |
| LOCALS CANNA HOUSE | $365,300 |
| THE BAKE SHOP | $362,840 |
| LIVING WELL ENTERPRISES | $358,930 |
| FORBIDDEN CANNABIS SUPER CHRONIC | $358,454 |
| KUSH 21 BUCKLEY LLC | $352,552 |
| KUSHMAN | $351,432 |
| FORBIDDEN FARMS | $350,215 |
Strategic Takeaways
1. Holiday discounting is now structural, not opportunistic.
It no longer signals surplus alone—it reflects competitive equilibrium in saturated categories.
2. Pricing power remains chemistry- and format-dependent.
Concentrates retained value where flower did not.
3. Market share, not margin, drove holiday strategy.
Larger operators used discounts to defend volume and visibility.
4. Demand was pulled forward, not expanded.
Post-holiday declines were swift and broad-based.
5. Policy risk is increasing.
Revenue volatility combined with concentrated market power raises questions about tax stability, small-operator viability, and long-term market health.
Join the Discussion
Your insights help drive better transparency and smarter policy in Washington’s cannabis industry.